Get insights into your workflows Dashboards.
The first time you access the main Dashboard, you'll see the Welcome Page and you can click Create my first flow to launch a Guided Tour.
Once you have executed a flow, you will see your flow executions in the dashboard.
Dashboard page
The Dashboard page displays both the default dashboard and any custom dashboards you’ve created. To switch between dashboards, use the hamburger menu. If you have over 10 dashboards, type the dashboard name in the search bar to quickly find it. The same menu also lets you edit or delete existing dashboards.
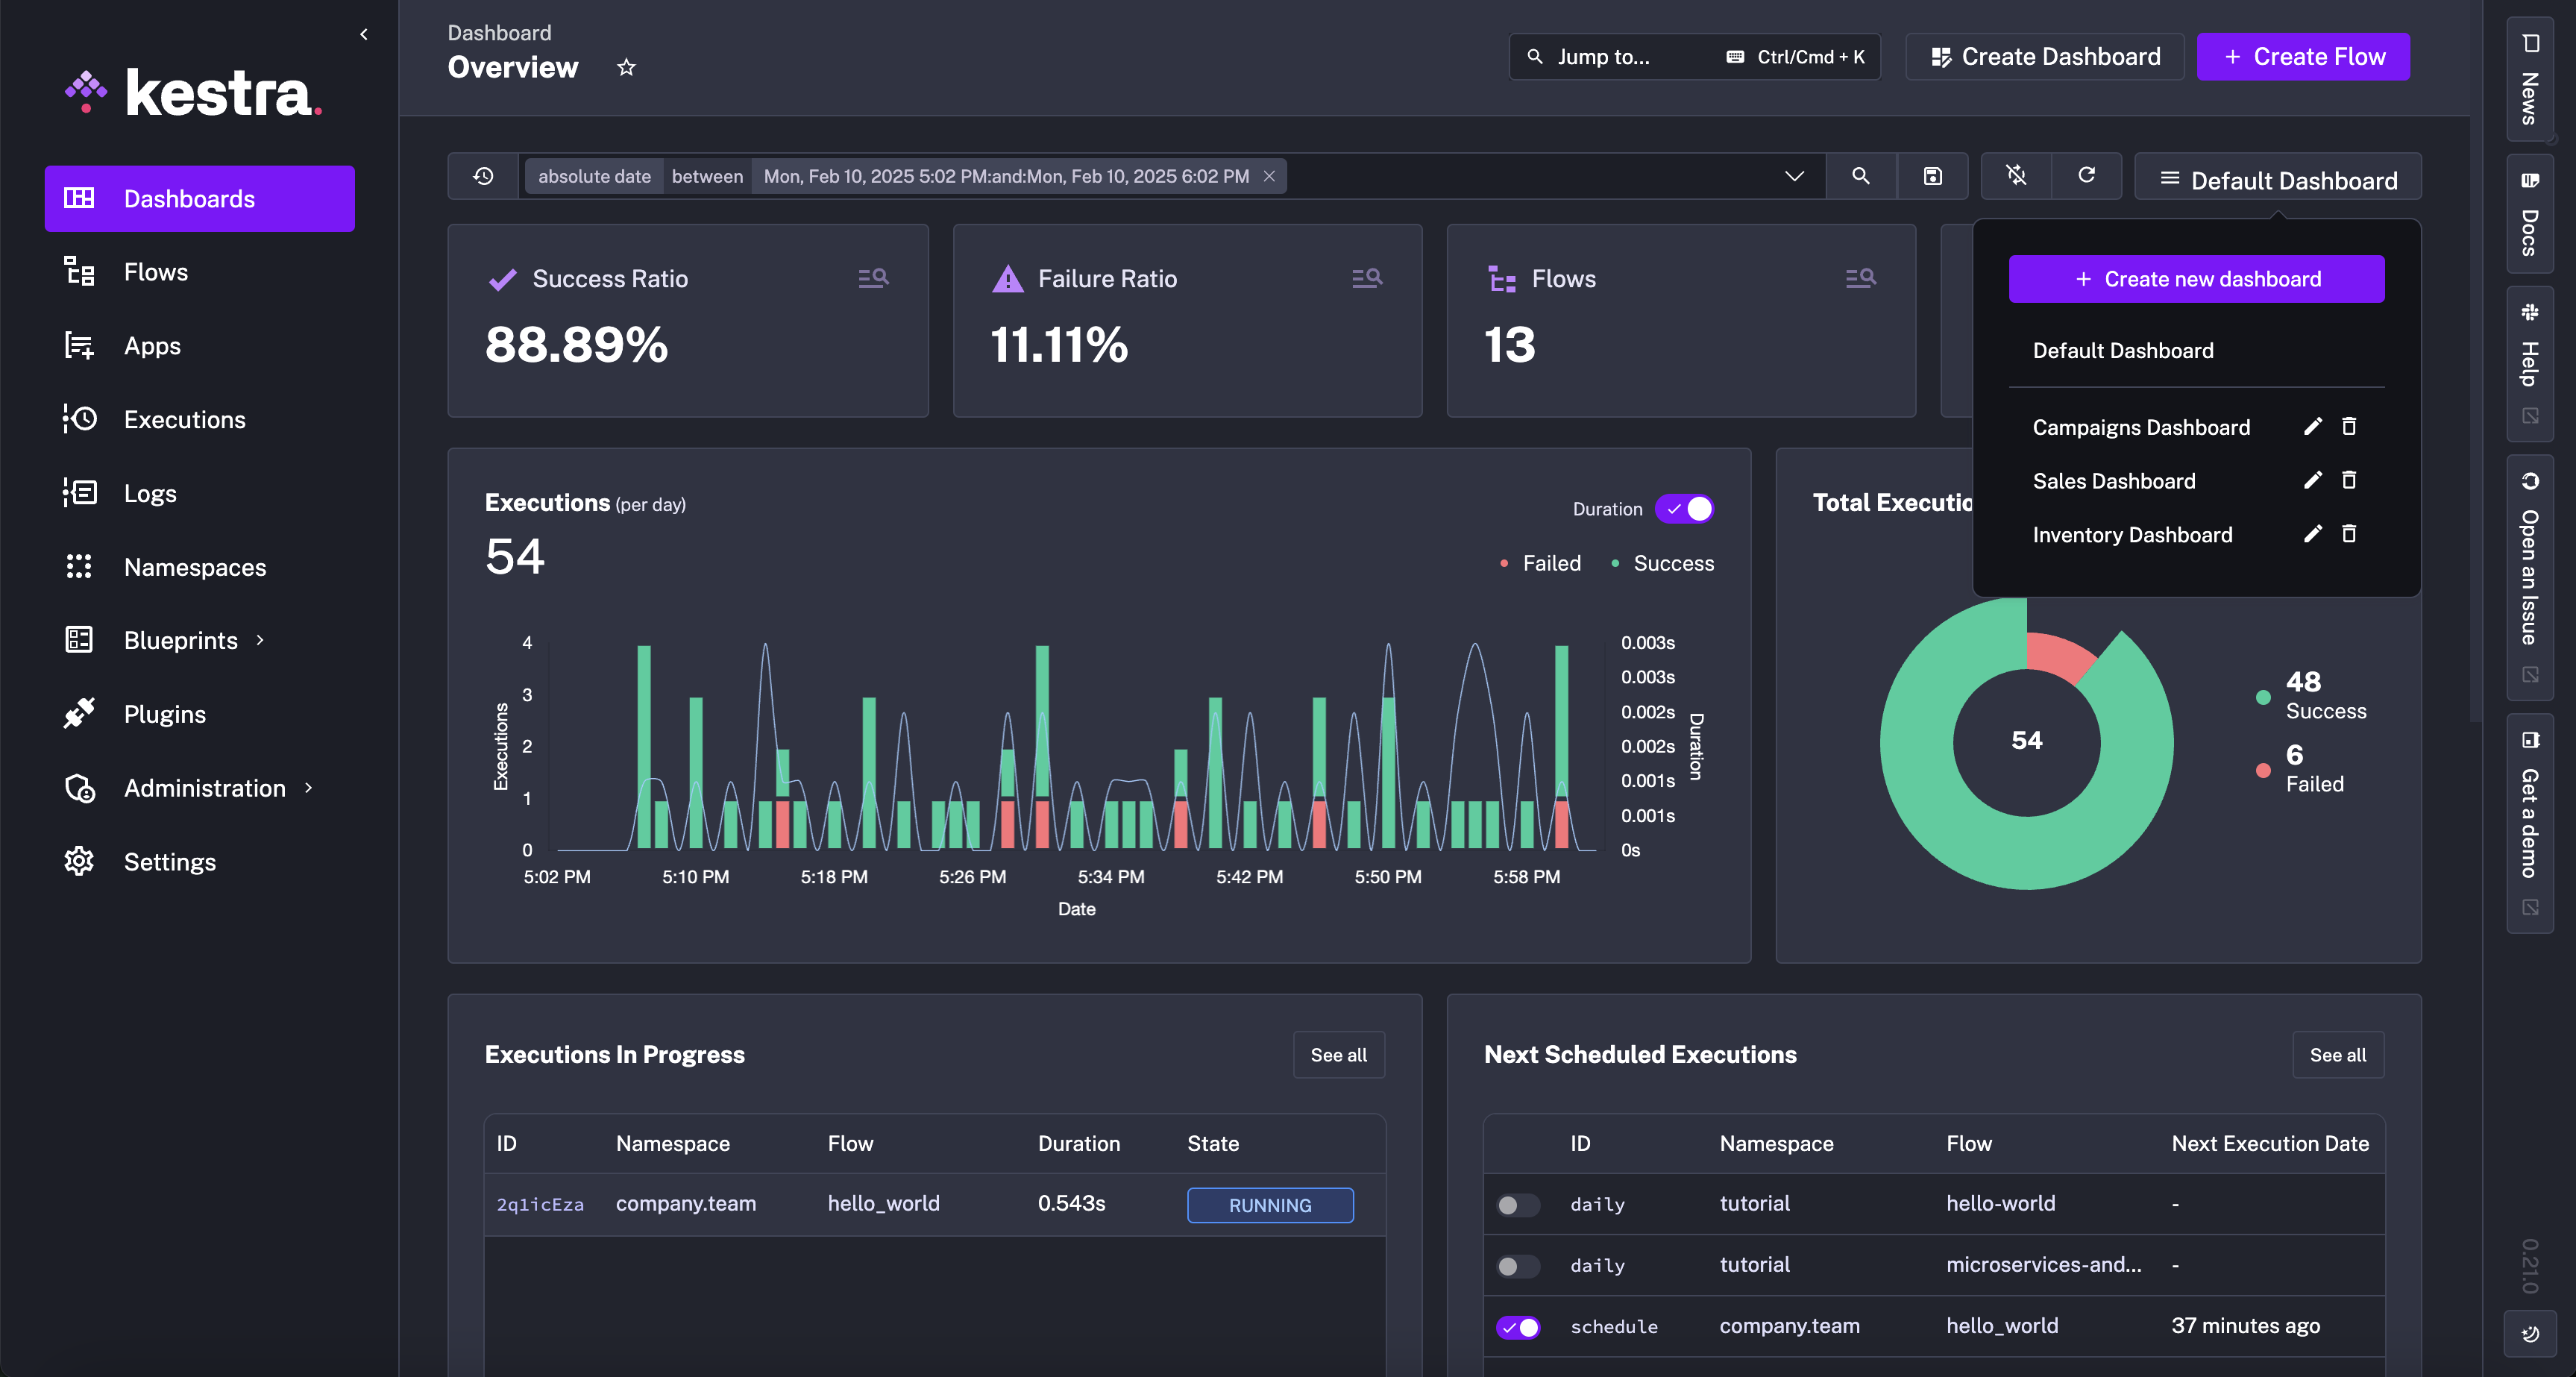
Dashboards provides a load of useful data right at your finger tips, including:
- Executions over time
- Execution Status for Today, Yesterday as well as Last 30 days
- Executions per namespace
- Execution errors per namespace
- List of failed Executions
- List of error logs
Custom Dashboards
Dashboards let you define custom queries and charts to visualize data on your executions, logs, and metrics. Rather than relying only on the default dashboard on Kestra’s home screen, you can create a custom dashboard with charts that answer specific questions and track key metrics.
Chart types
Dashboards support data visualization charts like pie and bar graphs, temporal data visualizations such as time series charts, tabular representations, as well as textual displays using Markdown. Each chart type is composed of chartOptions and data.
A chart's chartOptions property is where you customize display names and descriptions as well choose whether to add legends and tooltips to complement the visualization. A chart's data property is where you specify which Kestra data to use as a column or part of a pie chart, how you want the data displayed (e.g., an aggregate count or an ORDER BY), and add any filters you might want added to the chart (e.g., REGEX match, greater or less than, or not Null).
Each chart's options are listed in the Chart Plugin Documentation where you can dive further into the properties of each type. Below is a full code example of a dashboard using each chart and data type.
Create a new Custom Dashboard as code
Clicking on the + Create new dashboard button opens a code editor where you can define the dashboard layout and data sources as code.
Below is an example of a dashboard definition that displays executions over time, a table that uses metrics to display the sum of sales per namespace, and a table that shows the log count by level per namespace:
To see all available properties to configure a custom dashboard as code, see examples provided in the Enterprise Edition Examples repository.
Querying data
The data property of a chart defines the type of data that is queried and displayed. The type determines which columns are displayed.
Dashboards can query data from these source types:
type: io.kestra.plugin.core.dashboard.data.Executions: data related to your workflow executionstype: io.kestra.plugin.core.dashboard.data.Logs: logs produced by your workflowstype: io.kestra.plugin.core.dashboard.data.Metrics: metrics emitted by your plugins
After defining the data source, specify the columns to display in the chart. Each column is defined by the field and may include additional optional properties.
| Property | Description |
|---|---|
field | The only required field, specifies the name of the column in the data source to use |
displayName | Sets the label displayed in the chart |
agg | Defines the aggregation function applied to the column: supported aggregations include AVG, COUNT, MAX, MIN, SUM |
graphStyle | Indicates the style of the graph displayed: supported styles include LINES, BARS, POINTS |
columnAlignment | Specifies the alignment of the column in the table: supported alignments include LEFT, RIGHT, CENTER |
You can also use the where property to set conditions that filter the result set before displaying it in the chart. Filters can apply to any column in the data source. For shared logic, use the AND operator in the where property to combine several conditions. If multiple conditions are needed with different logic, use the type: OR property.
Available filter types include:
CONTAINSENDS_WITHEQUAL_TOGREATER_THANGREATER_THAN_OR_EQUAL_TOINIS_FALSEIS_NOT_NULLIS_NULLIS_TRUELESS_THANLESS_THAN_OR_EQUAL_TONOT_EQUAL_TONOT_INORREGEXSTARTS_WITH.
Available field types include the following columns:
ATTEMPT_NUMBERDATEDURATIONEND_DATEEXECUTION_IDFLOW_IDFLOW_REVISIONIDLABELSLEVELMESSAGENAMENAMESPACESTART_DATESTATETASK_IDTASK_RUN_IDTRIGGER_IDTYPEVALUE.
Note that some of the above are reserved only for specific types of data (e.g., the LEVEL column is only available for type: io.kestra.plugin.core.dashboard.data.Logs).
Was this page helpful?